glossary

 Neurophysiology of Team neurodynamics
The branch of physiology dealing with the functions of the nervous system of teams.
 Frequency
The Frequency of an EEG signal describes how fast the oscillation is occurring. It is measured in cycles-per-second, or Hertz (Hz). We normally measure from 1 - 40 Hz.
 EEG POWER
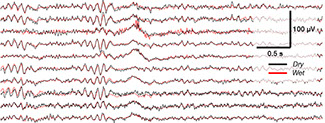
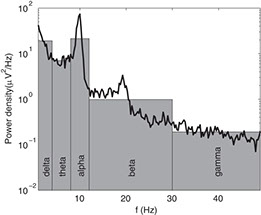
EEG Power is a measure that estimates the magnitude of oscillatory amplitude during a defined period. Brain patterns form wave shapes that are commonly sinusoidal. Usually, they are measured from peak to peak in the physical measure of micro-volts and normally range from 0.5 to 100 μV in amplitude, which is about 100 times lower than ECG signals. By means of Fourier transform power spectrum from the raw EEG signal is derived. In power spectrum contribution of sine waves with different frequencies are visible. Brain waves have been categorized into four basic groups: - beta (>13 Hz), - alpha (8-13 Hz), - theta (4-8 Hz), - delta (0.5-4 Hz).
As Neurodynamic Information (NI), is a measure of the pattern organizations in a data stream. As such they could represent persistent organizations of elevated or depressed or intermediate EEG power levels; i.e. they do not invariably represent periods of high or low EEG power per se. Making this distinction can be important, for instance, elevated gamma power has been associated with memory retrieval, whereas gamma power suppression has been associated with focused attention and during reading for comprehension
 Dimensionality Problem
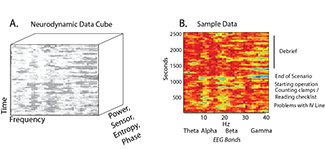
The Dimensionality Problem arises from the wealth of data being collected across different scales of time and systems. Multiple strategies exist for reducing this dimensionality including abstraction, compression, and signal redundancy. For team neurodynamics, the EEG of 3-5 persons are sampled 500 to 1000 times a second across a broad range of frequencies from 15+ scalp positions. These are then analyzed in concurrent time, or with leads and lags for up to a minute with parallel streams of speech flow and content and other team activities.
 information science
Information science is the discipline that investigates the properties and behavior of information, the forces governing the flow of information, and the means of processing information for optimum accessibility and usability.
 Bit
Bit
A Bit is the smallest unit of information; one bit of information allows you to choose between two equally probable alternatives.
 Entropy
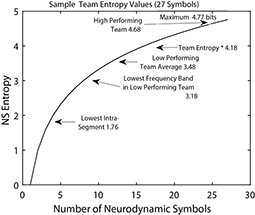
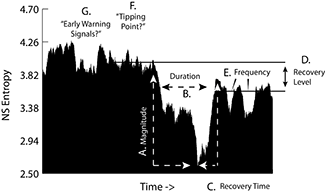
Entropy is the average surprise of outcomes sampled from a probability distribution or density. A NS density with low entropy means that, on average, the outcome is relatively predictable while a system with higher entropy would be less predictable. In this way a dynamic and quantitative pattern profile can be constructed and reported with a 1s granularity for real time modeling, or aggregated over a performance for comparisons across teams.
Entropy values might be confusing as low entropy means higher organization. To reduce possible confusion, the entropy values are subtracted from the maximum entropy for the number of symbols being modeled, i.e. 3.17 bits for 9 symbols or 4.775 bits for 27 symbols (Equation 1), this is termed Neurodynamic Information and abbreviated NI.
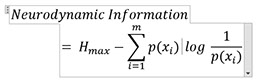
Equation 1. Neurodynamic Information
 TEAM NEURODYNAMICS
Team Neurodynamics: is the science of applying the measurement of neurophysiologic indicators to the modeling of teamwork, and is the study of the changing rhythms and organizations of teams from the perspective of neurophysiology.
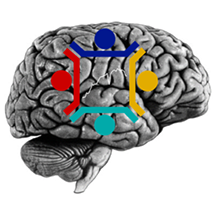
Neurodynamic organization is determined by using EEG signals, which is the recording of electrical activity of the brain at different regions along the scalp. The rhythmic patterns in the electrical oscillations from different brain regions contain signals representing complex facets of brain activity. Measures of NO are grounded in information theory and based on most biologic and behaviorally-related signals having internal patterns and organizations. Symbolic transformations of discrete data can be used to detect and quantitate the fluctuating dynamics of this organization. Information theory provides methods for determining when and how information is created, how it is stored, shared, and destroyed.
What exactly is information? Information has been described as ‘the difference that makes a difference’ (Bateson, 1972). For Claude Shannon (1951) the statistical properties of signals passing from sender to receiver were the information. In this context information had no meaning about the raw measurement units or the context of the system being studied.
These properties of information are useful for developing generic information-organization based models of teamwork as analytic frameworks developed for one information stream might be useful for understanding other streams of team information.
Using information metrics it becomes possible to quantitatively compare the neurodynamic organization of a surgical team, or a submarine navigation team, etc. or the organization of each of the members of any team in relation to the whole team, thus satisfying the third criterion.
Criteria
- Measures quantitatively track the second-by second dynamics of teams as well as the dynamic contributions each member to the team.
- Measures link to microscopic details of teamwork while helping explain observable team and team member functions.
- The measures are domain neutral so that systems developed for one team / task process should be able to be applied to other tasks containing teams of differing experience and expertise.
- The measures should have ecologic validity, meaning that they have been field tested under career specialist performance conditions. For team neurodynamics this has included: during live surgery, and, required training for submarine navigation teams.
 Neurodynamic Symbols
Neurodynamic Symbols (NS) are symbolic representations of the momentary power levels of a neurodynamic marker for each team member; at its simplest a NS would be the simultaneous power levels of two persons from a single EEG frequency bin at a single sensor channel.
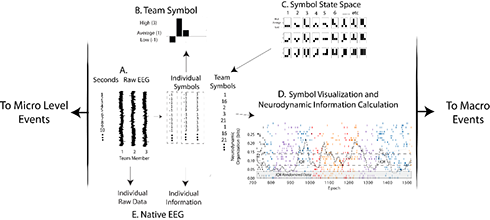
Steps for generating and modeling neurodynamic data streams.
(A, B) the raw EEG signals from each person are discretized each second into low, average, and high power levels and assembled into a NS. (C) The symbol matching the three person power array is determined from the NSS lookup table and assembled into a NDS, where, (D) the symbols are visually mapped and a moving average of entropy calculated each second. (E) Levels of raw EEG and normalized values (i.e. -1, 1, & 3) are calculated from the native EEG data streams.
 Neurodynamic states space
Neurodynamic Symbol States are a collection of NS that together describe the state possibilities of a team performance.
 Neurodynamic Data Streams
Neurodynamic Data Streams are chains of the second-by-second sequences of NS that temporally encompass a team’s performance.
 Neurodynamic Entropy
Neurodynamic Entropy is a quantitative measure of the distributions of NS in NDS when examined over a moving window (60s or 100s) of time. Entropy measures can be generated from symbols of either the team members or the team as a whole.
 Neurodynamic Information
- Neurodynamic Organizations (NO) are the patterns found in NDS, and represent the tendency of team members to organize into persistent neurodynamic relationships with each other. Quantitative measures of these relationships are Neurodynamic Entropy (NE) and Neurodynamic Information (NI).
- Neurodynamic Entropy (NE) is the degree of organization can be quantitated by measuring the Shannon entropy over moving segments (60s to 100s) of the symbol data.
- Low NE represents greater team neurodynamic organization. To clarify this relationship, entropy values are subtracted from the maximum entropy for the number of symbols being modeled, i.e. 3.17 bits for 9 symbols or 4.775 bits for 27 symbols. The result is termed Neurodynamic Information and abbreviated NI.
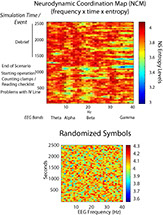
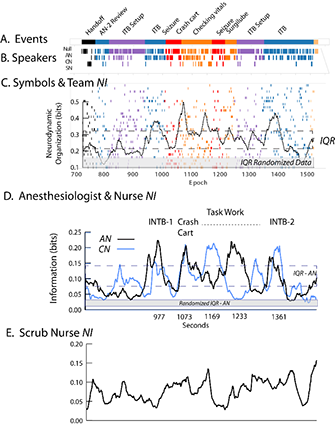
FIGURE ABOVE: Team and individual neurodynamics in the context of the events of a healthcare simulation. (A) The task event segments. (B) Periods where each person was speaking. (C) The symbols (Y-axis) in the neurodynamic data stream of the team were sequentially plotted each second (X-axis). A quantitative profile of the variability in the symbol distribution over a 60s time segment was obtained according to Equation 1. The NI is a profile of the bits of information averaged using all sensors and frequencies. The dotted lines indicate the Inter Quartile Range (IQR) and the gray line indicates the IQR for the randomized data. The extensive patterning in the performance is shown by the comparison between the IQR of the randomized and non-randomized data. (D) The NI traces of the AN (black) and CN (blue) during the simulation with selected events labeled. (E) The NI trace of the SN.
Neurophysiology
Frequency
eeg Power
Dimensionality Problem
information Science
Bit
Entropy
team neurodynamics
Neurodynamic Symbols
Neurodynamic states space
Neurodynamic data streams
Neurodynamic entropy
neurodynamic INFORMATION